7. Client Software
Sensor Web Client Software
Another important aspect of SWE is to visualize and analyse observation data. In this context relevant data is often denoted as time series data to indicate the temporal variety of observed phenomena, which shall be perceived using applicable graphs and diagrams. In addition, certain data might be visualized on an interactive map enabling users to click on those objects and trigger certain tasks. Within this section, information about sensor web clients are provided, starting with an overview of different architectural concepts. Afterwards, an exemplary SWE client is introduced, operating as a web browser application.
Architectural Concepts
Direct Interaction with SOS server
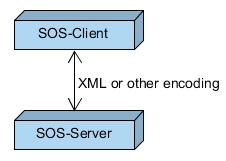
As an intuitive setting, SOS client and server could communicate directly. Clients would use the dedicated operations of the SOS to retrieve relevant sensor data. This implies that any logic for interactions as well as de- and encoding of SOS-requests and corresponding responses have to be executed by clients themselves. Hence this setting is only recommended when the SOS client is running on high-performance hardware.
Intermediate Component Performing Business Logic
In contrast to direct communication, an additional intermediate component can be employed to perform arbitrary intermediate business logic tasks. This intermediate component runs on high-performance hardware and encapsulates the communication with the SOS server. In addition, it may offer other functionalities, such as storing cached sensor metadata, perform generalization tasks (see below) or offer a lightweight interface (e.g. REST/JSON) to clients. Following this architecture pattern includes the advantage that complex business tasks such as decoding large XML datasets or caching of metadata is shifted from clients to a server-side component. However, the client side is not allowed to interactively add another SOS server and visualize its data as this knowledge has to be added to the intermediate component itself.
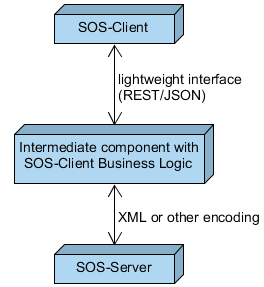
As request/response messages have to be frequently exchanged between a SOS client and a SOS, a REST interface can be facilitated for lightweight message exchange and reduction of message contents. With the help of a dedicated REST API, a SOS server (or intermediate proxy component) may provide an easy access to relevant observation data through a RESTful interface, where message exchange is realized by a JSON binding. Via dedicated REST API calls, only those elements, which are really necessary for client side visualization, can be retrieved. The benefit is that the content of exchanged messages can be minimized and, thus, message and network/bandwidth overload be reduced. This enables clients with an on-demand query interface for time series data.
With regard to queryable observation data, a REST API should offer retrieval of at least the following data:
-
Platforms/stations (sensor locations), where observations are made, in order to display them on a map or within a list for interactive selection. Can be used to filter observation data by procedure.
-
Geometries of features of interest to display them on a map. This could indicate the observed area, to which observation data applies.
-
Phenomena/observableProperties to enable users to filter observations by phenomena.
-
Observation data (time series data), e.g. to draw graphs/diagrams for a certain period in time.
As an example the REST API of 52°North offers the previously introduced features. A description of the API can be consulted at
Exemplary SOS Web Client
An exemplary browser-based JavaScript client is accessible via
It provides a visual interface to access measured and computed climate data within the context of renewable energies. The client itself is an adopted version of the 52°North sensor web client, whose GitHub repository is located at
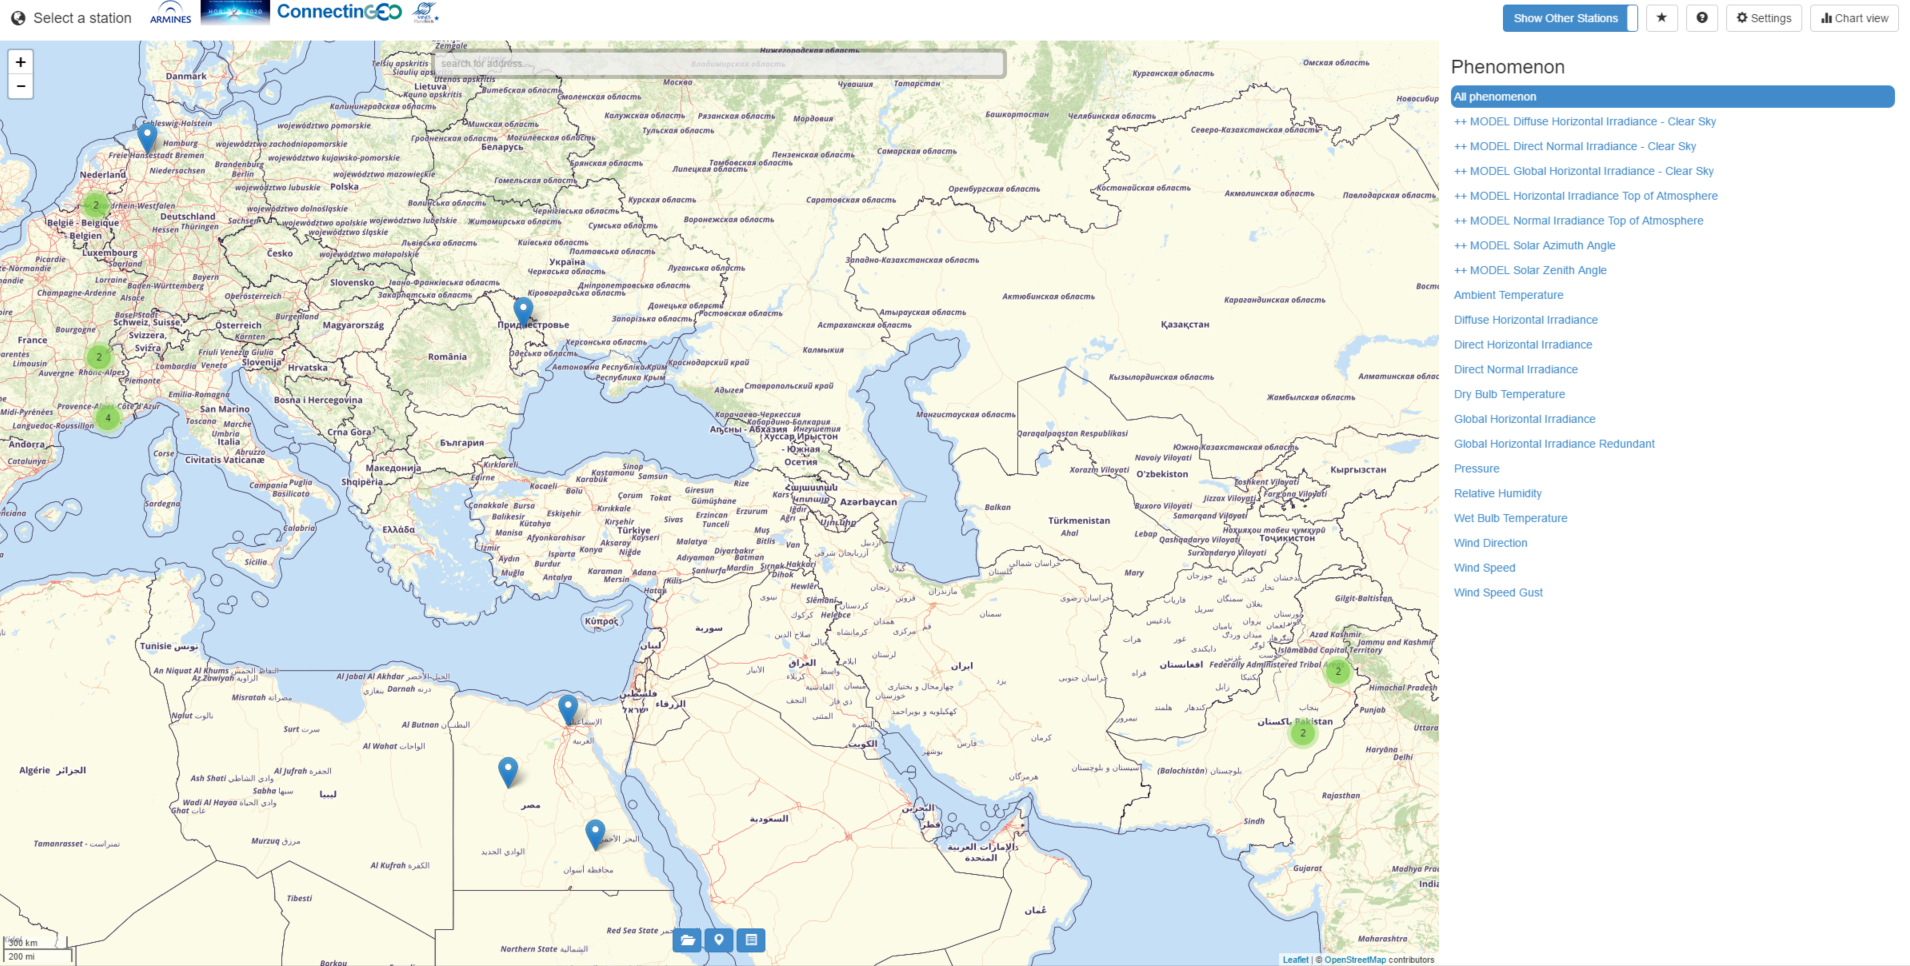
The client uses the REST API to retrieve observation data and display is accordingly. The below figure shows the landing page, displaying a map with available stations on the left as well as a list of available phenomena (observed properties) on the right.
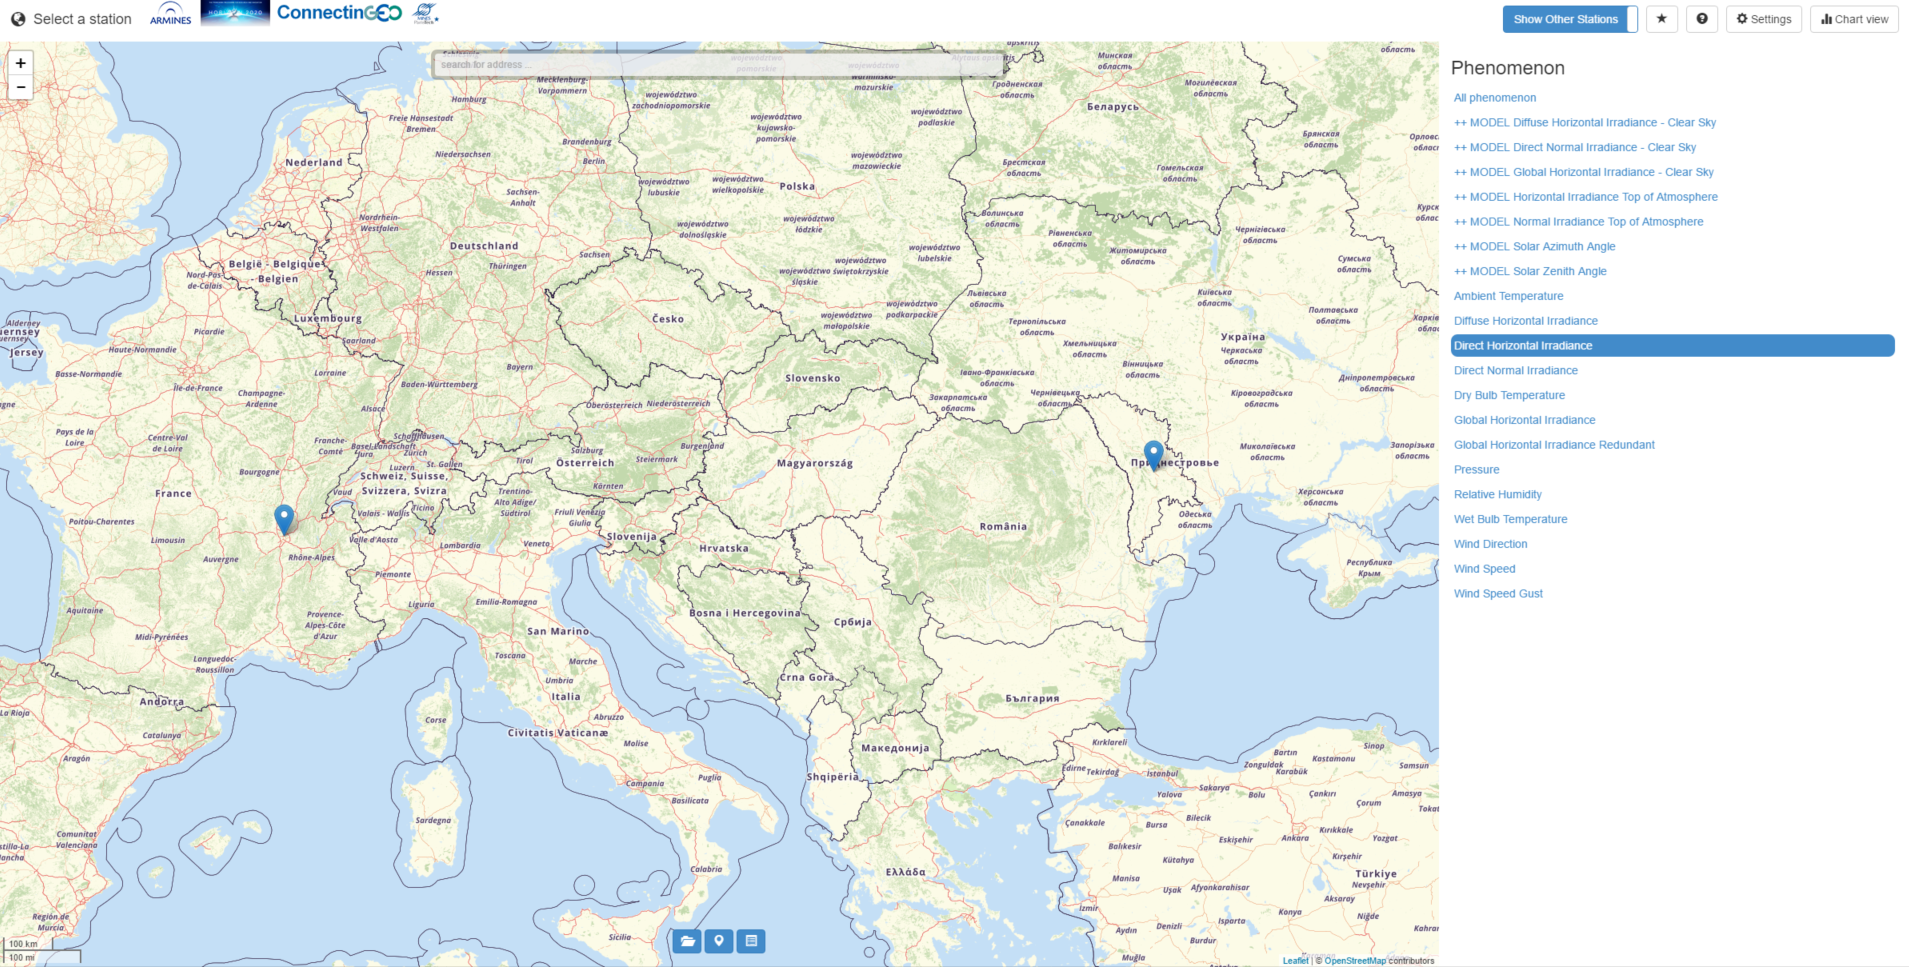
On startup, the relevant data (stations as well as phenomena) is automatically retrieved from the configured SOS instance (http://insitu.webservice-energy.org/52n-sos-webapp). Via the phenomena list, stations can be filtered. E.g. by clicking on the phenomena Direct Horizontal Irradiance, the associated stations are determined and the map view is refreshed showing only the remaining stations.
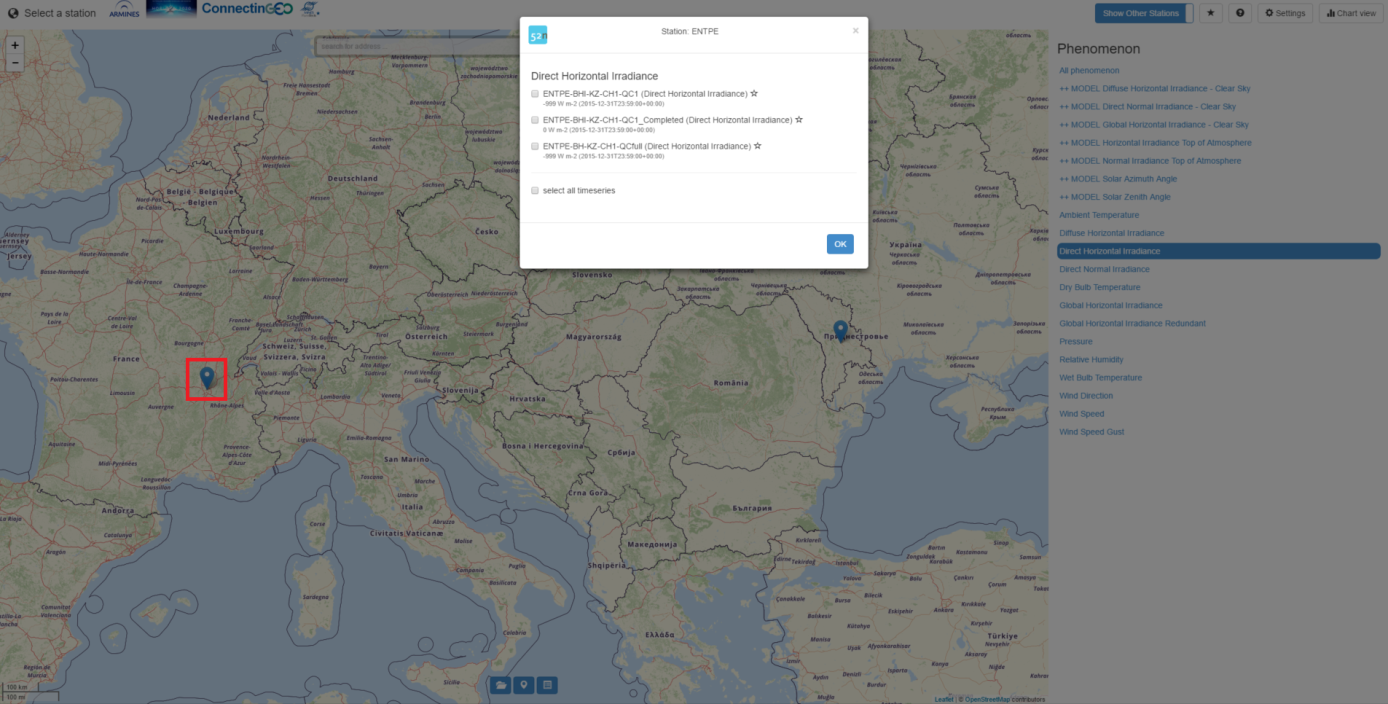
To visualize observation data, a station on the map has to be clicked, which opens a dialog box to select the phenomena according to the figure below. In this case, only the previously filtered Direct Horizontal Irradiance is available. User may select the time series datasets they intend to retrieve and visualize and click on the OK button.
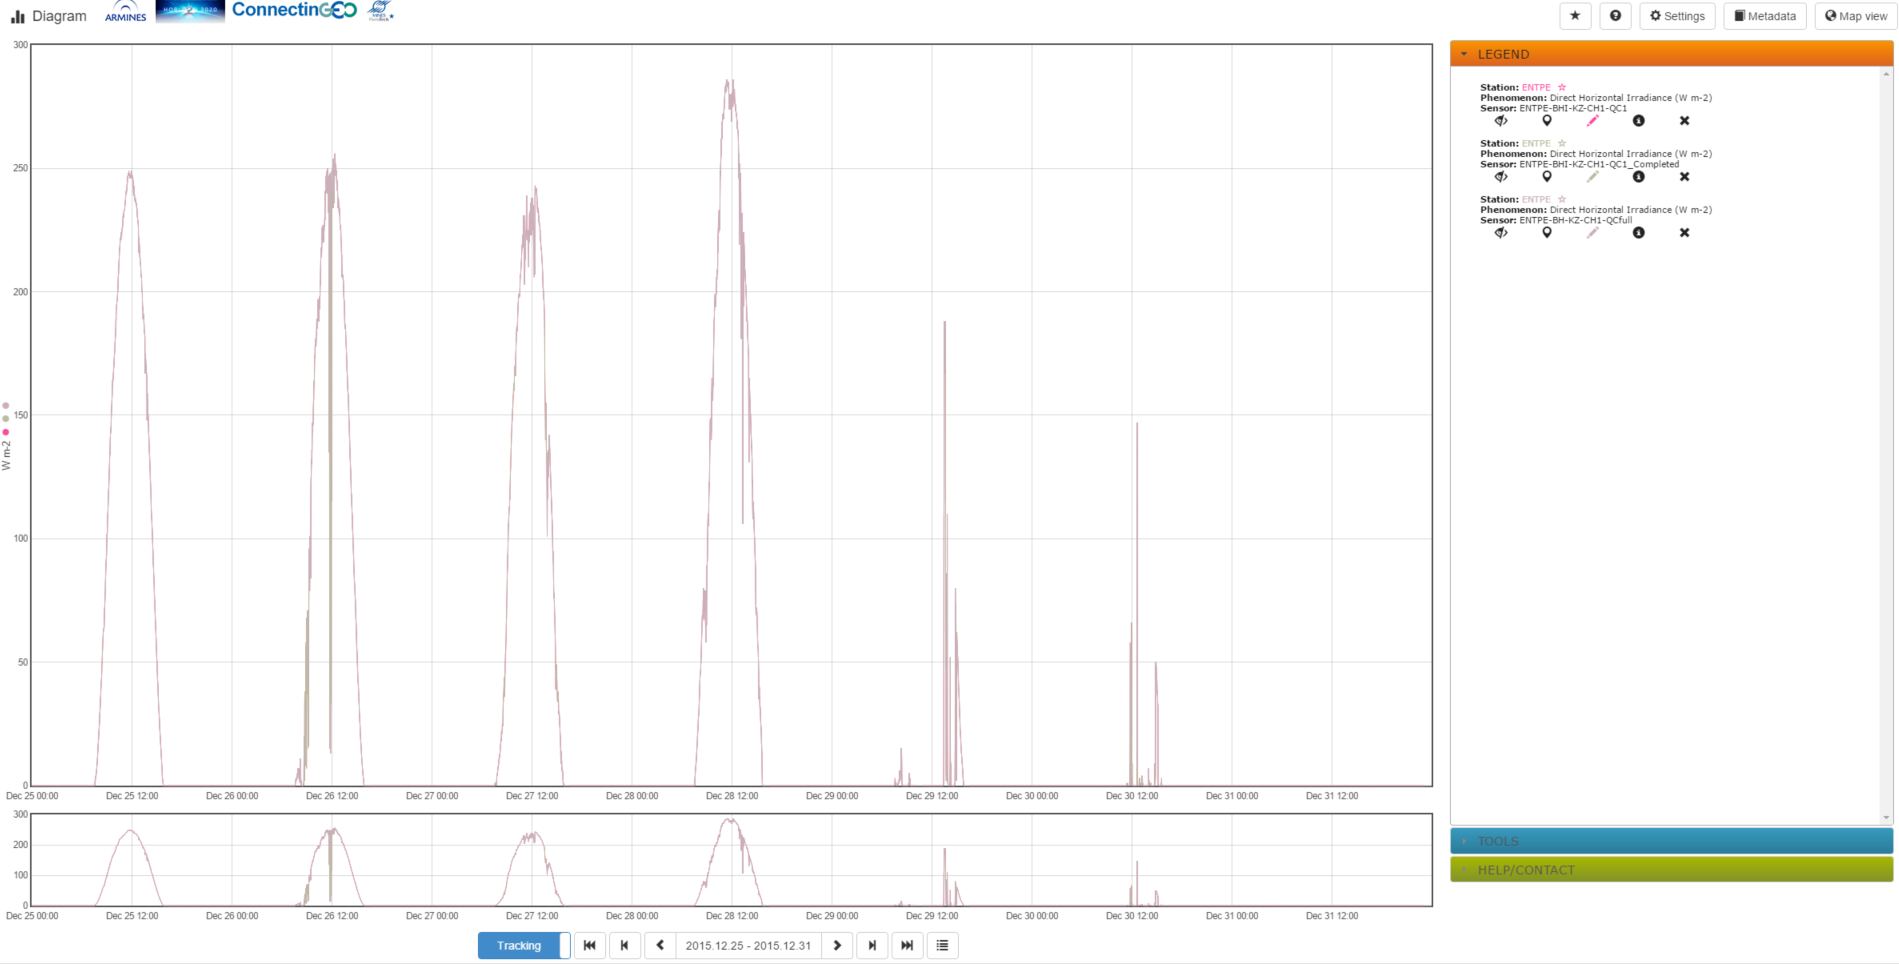
For instance, when selecting all three time series datasets, the client builds and executes a request against the REST API to retrieve available data for all selected datasets. To reduce the amount of data being requested, a standard time interval (the last available week) is added to the request. After fetching the data, the client creates a graph visualization, as shown in the following figure.
The graph shows the value distribution of the selected phenomena for seven days, each day annotated at midnight and midday. Using this graph view as a basis, analysis can be executed. For instance, as the Direct Horizontal Irradiance is associated with sunlight, it is not surprising that the highest values occur at around midday and that during the night the values remain 0. The client offers more interaction for further investigation. E.g. the displayed time period can be changed (using the time options below) causing the client to re-request the data according to the new time period. On the right side, the dataset options, such as show metadata, show/hide or remove dataset, can be performed. Concluding the lightweight client allows access to and visualization of observation data stored in a SOS. It might serve for basic analysis of time series data. Of course, additional high-level analysis tools can be offered via a suitable GUI interface.
Additional Considerations
In addition to the already described functional requirements of a SOS client, other generic capabilities need to be discussed. For this reason, three topics regarding data generalization as well as data archiving are addressed subsequently.
Generalization
When visualizing time series data within diagrams and graphs, generalization aspects have to be taken into account. Mostly, the number of available measurements is much higher than the number of displayable datasets. For instance, if a time series comprises hourly data and a client intends to visualize the data of a whole year, then approximately 8500 values will be displayed. Considering that most client displays allow diagram sizes of less than 1000 pixels, only 1/8 of the requested data could be visualized. In addition including all of the requested data might result in a large document that has to be transferred via a Web connection. For this reason, the requested data should be generalized in order to reduce the amount of transferred data. Hereby it is important that the overall characteristics of the requested data is preserved and the data is not falsified.
Permalink to Certain Visualization
If the user of a SOS client has selected certain time series and even individualized its graphical representation, it is aspirational to make it reproducible with a minimum effort. In consequence, a SOS client might offer so-called permalinks for the current view, with which the selected datasets as well as configurations of visual properties can be re-accessed at a later point in time.
Data Download/Export
To archive the visualized time series data, SOS clients might offer a download or export functionality. This should include archiving the actual measurement data (e.g. as CSV file or Excel sheet) for usage in other computer programs. In addition, the export of the current diagram view within reports (e.g. PDF file) could be offered.
